This topic covers the basic analysis functions in TRIOS software. The list of available functions varies based on the type of data obtained. For additional information, refer to Analysis Models and/or Basic Steps to Analyzing Data Help topics.
Click an analysis function below for more information. Once you have completed an analysis, refer to Basic Steps for Analyzing Data to edit the analysis and evaluate the impact on the calculated parameters.
See Also
Use the Signal min option to determine the minimum measured value between two selected points on a curve. Use the Signal max option to determine the maximum measured value between two selected points on a curve. See Basic Steps to Analyzing Data to select associated analysis options before beginning.
Use the Signal change option to measured the change in the measured values between two defined points of data. A horizontal line is drawn from your selected start point to a vertical line drawn from your selected stop point. The difference between these points is reported. See Basic Steps to Analyzing Data to select associated analysis options before beginning.
Use the Peak height option to determine the point of maximum deviation from a linear baseline drawn between two points on the curve. After you select the start and stop limits to define the baseline, the program calculates and reports the height of the peak. See Basic Steps to Analyzing Data to select associated analysis options before beginning.
Use the Peak Integration options to calculate and report the following:
The peak is integrated with respect to time between the designated start and stop baseline limits. You select type of baseline used from the Analysis option (see below). See Basic Steps to Analyzing Data to select associated analysis options before beginning.
Linear Type
Onset Type
A sigmoidal baseline is an s-shaped line that changes in level and/or slope before or after a peak. It is used to compensate for the change in baseline that occurs during a transition; the baseline is adjusted for the fraction reacted (alpha) versus time.
A sigmoidal baseline initially is calculated as a straight line between the selected limits. It is then recalculated for each data point between the limits as the weighted average between the projected horizontal or tangent baselines at peak start and end. The weighting factors for a given point are: (1) one minus alpha times the initial baseline and (2) alpha times the final baseline. The area is then recalculated with the new baseline. If the new area differs from the previous area by more than one percent, the area is recalculated and the sigmoidal curve shifted repeatedly until two consecutive calculations of the area differ by no more than one percent. If the baseline fails to converge within ten iterations, the calculation is aborted.
Left/Right Limits
Onset Type
The peak area is normalized for other instrument types only when the signal being integrated is normalized.
The peak onset is calculated as the intersection of the onset tangent line with the calculated baseline. The onset tangent line is fit to the current X-axis type, and can be selected in automatic mode (the default condition) or manual mode (selected using the Analysis Options > Peak Integration page).
If the measured data includes superheating or supercooling (temperature hysteresis of more than 0.25°C), the onset point is determined at the superheating or supercooling point. Superheating and supercooling are relevant only if the X-axis is temperature.
Use the Onset point analysis option to determine the temperature at which a change in the slope of the curve occurs (i.e., the onset point of a transition). The onset point is defined as the intersection of an initial tangent line with a final tangent line.
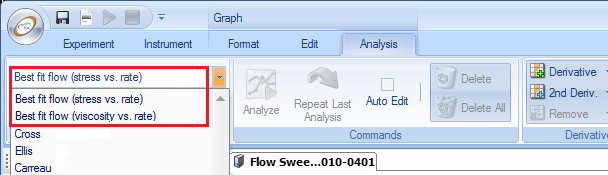
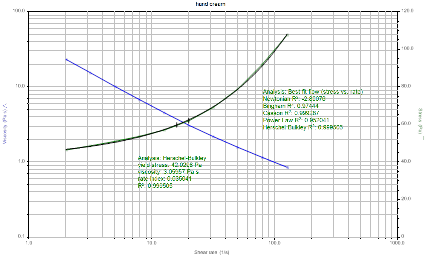
Use the Best Fit option to generate two labels for flow curves: one with R2 values for all the applicable models, and one complete analysis for the one with the best value. From the Analysis menu, select Best fit flow from the Function toolbar.